Module 2
- Aug 29, 2024
- 12 min read
Updated: Apr 7, 2025
Element 2a: Plan routes
i. Explain the factors influencing the choice of a suitable route
There are lots of factors that can influence the choice of planning route for a group. These can include:
Information availability for the route being planned: This can include looking at factors about the trail, such as is it part of a pre-planned trail, is there information about the route online, does the group leader have map of the route available, is there toilets, shelter, rest stops, water sources or other facilities on the route? As well as information about route safety, for instance, is the route safe, accessible for emergency services, in a well known area and well lit if planning on walking at times of darkness?
How many people are attending and where from: Wether you are walking on a solo walk the route can be chosen by the individual to suit them, however if with a group the route will need to be comfortable for everybody in terms of length, steepness, accessibility, etc. Also factor in possible travel times to get to the location.
Skills and fitness level of the group: the suitable route will also depend on personal fitness and skills, for instance picking a low-level, flatter, walking route compared to one travelling up a mountain and harder terrains with more obstacles.
Weather and the area: This will have an impact on how long the route is, where you go, is it undercover or out in the open? In harsher conditions such as snow or heat, the path may become more difficult to access and may not be suitable for the group.
Accessibility and Inclusion: Is the route suitable for all who may wish to attend, for instance those with mobility challenges, or those who want to bring young children? Is there enough signage to give directions to those that may have an impairment if needed?
What equipment is available to the group: This will have an affect on the route and what needs to be brought, for instance how much will need to be carried, is it possible to carry it between everybody, etc.
ii. Plan a route in lowland country suitable for the group
I have planned a route for my 'Inspire' walk around Delamere Forest in Cheshire: https://explore.osmaps.com/route/25866123/delamere?lat=53.23514&lon=-2.68947&zoom=13.099&style=Leisure&type=2d
Below is also the route card based on a 3.5kph walking speed:

iii. Estimate realistic speed of travel
To estimate your walking speed, you can calculate your pace or speed using the following formulas:
Pace: Pace is calculated by dividing the time it takes to walk a distance by the distance. For example, if you walk 6 miles in 2 hours, your pace is 20 minutes per mile.
Speed: Speed is calculated by dividing the distance traveled by the time it took to travel that distance. For example, if you walk 1.5 miles in 0.5 hours, your speed is 3 miles per hour.
To estimate how long a walk will take based on distance you can use the formula Time = Distance ÷ Speed, For example, if walking 3 miles at an average pace of 3 miles per hour, it will take approximately 1 hour.
Here are some average walking speeds:
A Normal Walking Speed, moderate to fast: The average walking speed for most adults on flat, smooth surfaces is between 3 to 4 miles per hour, (4.8 to 6.4 km/h), walking at around a mile in 15 to 20 minutes.
A Comfortable Pace: Most people walk at about 3 miles per hour (4.8 km/h) under typical conditions.
A Slow or Leisurely Pace: For a more relaxed pace (e.g., strolling), the speed may drop to 2 to 2.5 miles per hour (3.2 to 4 km/h), taking around 30 minutes to walk a mile.
Some information to help estimate your walking speed while walking can include:
Using Naismith's rule: A rule of thumb that estimates hiking time by adding one hour for every 3 miles (5 km) of forward travel, plus an additional hour for every 2,000 feet (600 m) of ascent. For a reasonably fit and steady walker: 15 minutes for every kilometre of horizontal distance, plus 10 minutes for every 100 metres of ascent. The time should be calculated for the slowest person in a walking group.
Factors which may affect your walking speed include:
Elevation gain: Add 10 minutes to your total time for every 100 meters of elevation gain.
Bag weight: Heavier bags can effect walkin speed, if there is significant weight, this can reduce speed by 10 to 20%.
Weather: Strong wind, hot sun, snow, and rain can slow you down.
Altitude: Some people feel breathless and fatigued above 2,000–2,500m.
Walking speedometers: Devices like GPS trackers, fitness bands, and smartwatches can show your speed.
Pedometers: Some non-GPS pedometers estimate speed and distance based on your step cadence.
Fitness levels, age and health conditions: A range of information may inpact speed and pace.
iv. Prepare a simple route card which gives essential information
A simple route card planned for walk number 2, in Delamere Forest, Cheshire. This walk was used as a base for planning the Inspire element.:
*This walk did not go ahead on this day


v. Plan for any difficult or hazardous sections of the route
Following on from completing a Recce of Delamere forest for my 'Inspire Walk', I have evaluated the walk which is lowland county. Difficult or hazardous sections have been discussed in the risk assessment created, and include water at the side of the paths, roots sticking out of the ground and uneven ground. All members will be informed about the area and advised to bring suitable shoes for the trip and stay away from the sides of the paths where water can be found.
vi. Demonstrate a clear understanding of the definition of lowland countryside and hence the remit of level 1
As per the Girlguiding Walking in Lowlands page, Lowland countryside can be defined as "Lanes, tracks and paths, fields, woods, or other non-remote lowland areas, where the ability to read a map and find a route may be necessary, but weather conditions won't be extreme and the types of country won't present any great problems."
Lowland is typically described as an area of land which is at, near or below sea level and away from mountains or large hills, typically no higher than 660ft, which is a generally flat terrain. Characteristics of a Lowland countryside area may include:
Flat or gently rolling terrain
Have slow flowing steams or rivers flowing through them
Areas are often used for farming or agriculture
Villages and farms may be around the area or a higher density settlement
Historic features such as churches and barns may remain
Element 2b: Use a map and a compass effectively
i.Explain conventional mapping symbols, scales, contour lines and grid references used on Ordnance Survey 1:500000 or 1:25000 maps
Find below links to two helpful documents created by Ordnance Surveys regarding their symbols, scales, contour lines and more:
Below is an explanation of mapping symbols and areas on a map and what they mean:
Built up areas such as towns and villages:
Buildings: Represented by black blocks or outlined in black.
Urban Areas: Dense areas with lots of buildings often shown with shaded grey or black areas.
Railways: Black lines with rail tracks indicated by small perpendicular marks across the line.
Roads and Paths: Roads are shown as red or black lines, with thinner lines for smaller roads and paths.
Car Parks: Shaded squares or rectangles with a P symbol.
Hospitals, Schools, and Other Buildings of Interest: These are marked with specific symbols that can be found in the map’s legend (key).
Natural features such as rivers and forests:
Rivers and Streams: Shown as blue lines. Larger rivers may have a wider blue line, while smaller streams use a thinner line.
Lakes and Ponds: Shown as blue areas, sometimes with outlines.
Forests and Woodlands: Green shaded areas represent forests or woodlands, sometimes with tree symbols within the shaded area.
Coastlines: Represented by a blue line, sometimes with additional symbols indicating cliffs or beaches.
Contours: These lines indicate changes in elevation and are discussed below.
Land Usage such as farmlands and hills.
Fields and Farmland: Areas of farmland are often shown in light green.
Hills and Mountains: Contour lines and shaded relief are used to represent elevation and topography.


Below is an explanation of scales of a map determines the ratio between distances on the map and real-world distances.
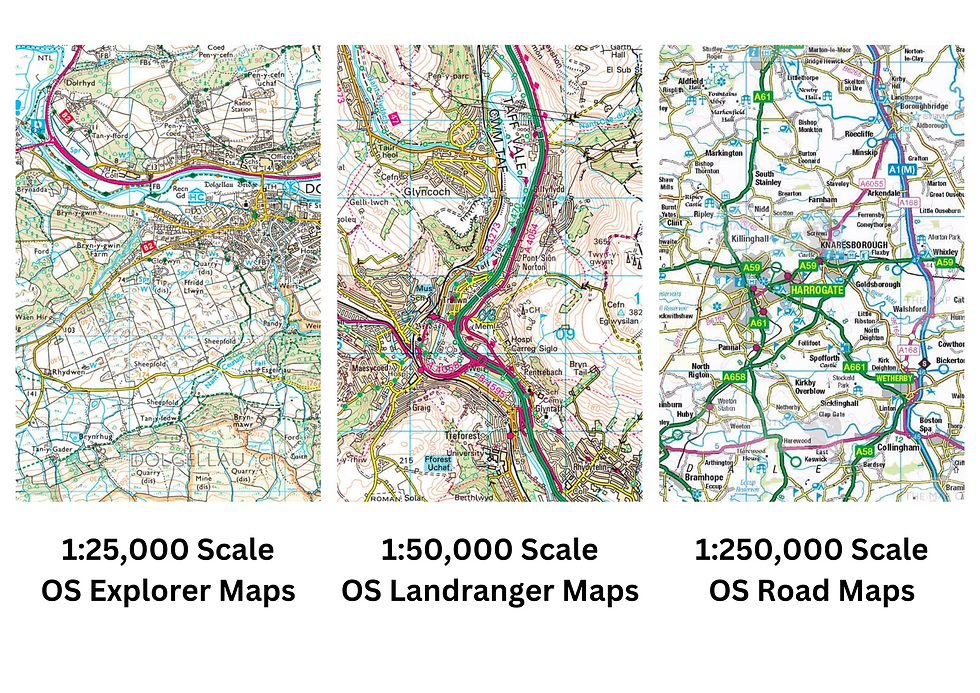
1:500,000 Scale: A 1:500,000 is classed as a small-scale map. This can mean that the features that are on the map as smaller symbols, with the map covering a large geographical area. Every 1 cm on the map represents 5 km at a 1:1 scale. These maps are useful for overviews of areas, such as country or regional planning, but can be harder to use for planning more detailed routes or local orientation.
1:25,000 Scale: 1:25,000 scaled maps are large-scaled maps. In these maps, every 1cm on the map is 250 meters at a 1:1 scale. This scale helps provide a more detailed view and can be used for walking, hiking, and other land navigation. A 1:25,000 map is more precise and includes smaller features as listed above, including individual buildings, trails, and smaller roads. Explorer OS Maps are in this scale. To help figure out lengths of a route, every 4cm on a map is 1km in real life. Grid lines used on these maps are exactly 4cm apart, so every square is 1km by 1km.
Other OS Maps can include:
OS Road Maps: 1: 250 000 scale, shows roads and towns, but few individual features over a large area
OS Tour Maps: 1: 100 000 scale, shows an overview of road, rail and sea connections plus tourism features for extended trips. GB Tour Map is 1: 550 000 scale.
OS Landranger Maps: 1 : 50 000 scale, shows roads, large paths and some individual features
OS Explorer Maps: 1 : 25 000 scale, shows many features including paths and buildings over a small area
OS MasterMap: 1: 1 250 scale, shows accurate position for individual buildings or small areas
Below is an explanation of contour lines and their use on maps:
Contour lines are used to represent the elevation and shape of the terrain on a map and are a brown line on OS Explorer maps. The function of Contour Lines connect points of equal elevation. The closer the lines are to each other, the steeper the slope. Contour lines often include numbers which indicates the level of terrain above sea level. Contour lines help with planning routes to figure out how much of an incline and decline a walker may face.
Below is an explanation of grid reference and how to use them on maps:
Grid references on Ordnance Survey maps are used to pinpoint exact locations and figure out routes. They often through use six-figure grid references, especially on 1:25,000 maps, and use four-figure grid reference for larger maps such as 1:500,000.
The grid system uses grid systems to split a map into specifically sized grids to divide up the areas. These grids are marked with vertical and horizontal lines to create a series of numbered squares. Vertical grid lines are called Eastings, with their numbers increasing from left to right, and the horizontal lines are called Northings, which increase their numbers from bottom to top.
Below is a video from the Ordnance Survey Youtube Channel:
Key things to remember whilst reading map grid references:
Start by identifying the easting and northing numbers on the map’s grid. Move horizontally first before going vertically across the grid to pinpoint the location of interest. The more digits in the grid reference, the more precise the location. A four-figure grid reference (1:500,000) shows a broad area, while a six-figure reference (1:25,000) is more detailed.

ii. Use these maps, relating map to ground and ground to map


iii. Compare the pattern of contour lines on the map with land forms on the ground


Whilst across the lake, I was able to see High Bank crag and compare them to the two peaks to those on the map to see thow the land sits within the area, getting a better idea of how contour lines help picture the terrain.
iv. Measure distances on the map

Using the scale rulers on the side of my compass I was able to figure out where we were on the map and measure how far we were from the bridge to go around the river. Using the ruler, I was able to measure we had roughly 1.35km until the bridge.
v. Demonstrate how to find north using a compass
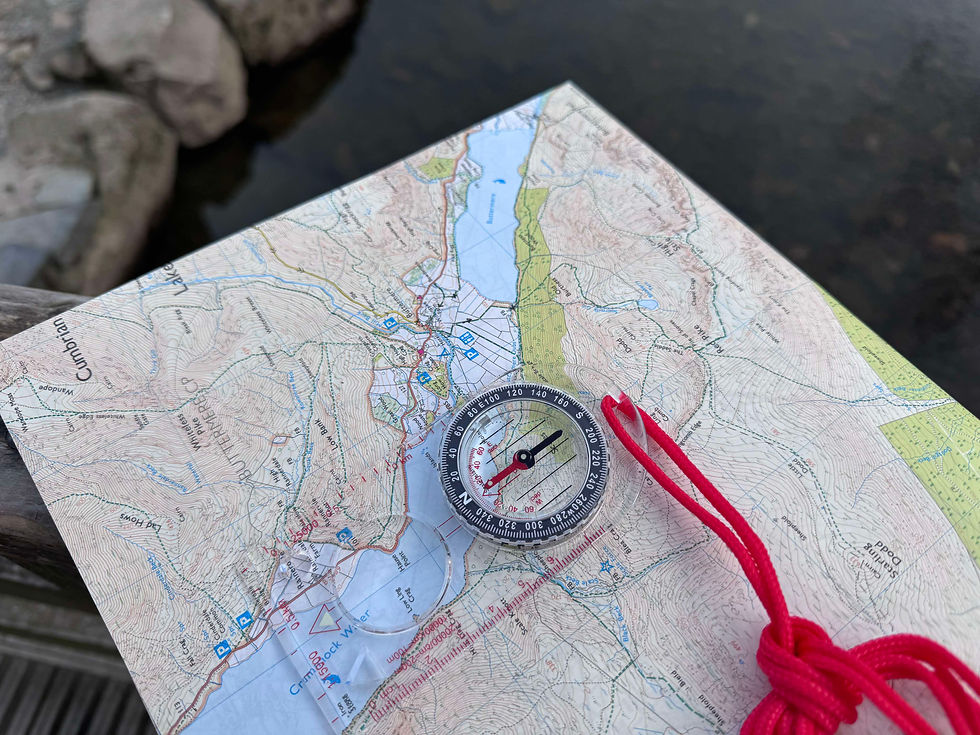
Using my compass I was able to set north by turning the compass dial so 'N' matched up with the red arrow which points north.
vi. Set the map to ground with and without a compass
Setting the map to ground with a compass. By having the compass set to North as well as the map pointing North.


Setting the map to ground without a compass. By using the water and surrounding hills, paths, a house and landscapes, I was able to figure out which was the map was needing to be set.
vii. Explain the features of a well-designed compass
The features on a compass include:
The baseplate is the plastic base which includes a ruler to help measure distances on a map, and include a map scale for comparison. They sometimes include a direction of travel arrow to show the direction you need to travel.
The compass dial, or compass housing or bezel. It shows the four main compass points N-S-E-W. It also has a mark every two degrees up to 360 degrees. This should be easy to read with visible numbers. The Compass housing should be able to rotate, allowing the user to set the direction for bearings and navigation, and should be able to lock in place to prevel accidently movement whilst navigating.
The magnetic needle has a red end to indicate north and a white end for south. This should be accurate, balanced and moves around easily without sticking to provide a clear reading. The compass should be liquid filled to help stabilise the needle.
A compass should be able to illuminate to be able to use in darkness, this illumination should be on the needle and degree dial, and can be charged by light.
Durability and weather resistant, weathers should not be able to access the compass, and should be able to hand exposure to rain and different temperatures, as well as being able to be used mulitple times and withstand being dropped and handled.
Element 2c: Demonstrate navigation skills
i. Find the way by using a map and comparing it with what you can see
By setting the map to ground I was able to use what I could see around us to pinpoint where we were on the map. This was done by using the water and surrounding hills, paths, a house and landscapes, and comparing it to map. Noting we were on the right hand side of the water, looking at land shapes around the water and the hills and a small building tucked in the trees, I was able to figure out where we were on the map.
ii. Indicate your position on the map at any time


iii. Use a route card and judge pace on a walk in lowland country
Using this route card, planned for Delamere Forest for the Recce for the 'Inspire' element, below are the actual times which it took us to walk:
Left the visitors centre at 11.45
Crossing the Railway Bridge: 11.54 (9 minutes / 13 minutes)
Second Railway Bridge: 12.02 (8 minutes / 10 minutes)
Towards the Lake: 12.12 (10 minutes / 13 minutes)
Hunger Hill: 12.19 (5 minutes / 9 minutes)
B Road: 12.31 (12 minutes / 19 minutes)
First Railway Bridge: 13.05 (34 minutes / 35 minutes)
Visitors Centre: 13.15 (10 minutes / 12 minutes)
(Actual time: 1 hour 30 minutes / Proposed time: 1 hours 50 minutes) - Average speed walked, 4kph.
iv. Discuss methods of leading a group and navigating at the same time
Leading a group and navigating at the same time takes a combination of skills, including leadership, communication and navigation. It is important that as a leader you are overseeing the groups safety and everyone is aware of the route and plan. Some key leadership and navigation points include:
Preparing and planning for the group walk: This includes knowing the route you have planned in detail, with alternate routes available if there are any incidents or path closures and contingency plans, looking at the terrain, facilities, parking, meeting points, water sources, potential hazards, and more. It also includes making sure the group are aware of the walk, which can be done through a briefing the group pre-walk discussing the duration of the walk and any challenges they may face on the route, making sure everybody is prepared.
Clear communication which is effective with the group: If you are in a group with people who are taking on different roles, such as first aider, group leader, back up navigator, etc, it should be clearly coordinated who these people should be, and tasks can be delegated out during the walk. Checking in with member sof the group throughout the walk to see how they are and if everybody is okay, allowing for breaks when needed. Using clear directions when needed so the group knows which direction they are going next, for instance going down the left path or the right. The group leader should also be able to be found easily and identifiable, typically at the front of the group, not going too far ahead, but to be able to set a good pace for the group.
Navigating and group management: Being able to use a compass and map throughout the walk if needed, and being able to glance at a map. The group leader should be able to adjust the pace where needed to suit the groups needs, making sure nobody is left behind. Health and safety of the group should be monitored throughout, as well as making sure people are eating and drinking enough, this can be done by planning rest stops.
Having awareness of the environment: Making sure the environment is suitable to continue the walk, making sure that the group is on course and checking the terrain, signs and landmarks, and being able to spot if potentially lost. Having a contingency plan in place will also allow for any flexibility in the walk, such as if a path is blocked or closed. If something does not go to plan, being able to stay calm under pressure and analyse the situation, when to turn back or seek help.
v. Show how to work out where you are if you get lost
By setting the map to ground I was able to use what I could see around us to pinpoint where we were on the map. This was done by using the water and surrounding hills, paths, a house and landscapes, and comparing it to map. Noting we were on the right hand side of the water, looking at land shapes around the water and the hills and a small building tucked in the trees, I was able to figure out where we were on the map. At this point I was not sure where we were on the map, but by using landmarks I was able to find out where we were.

Comments